
Scatter Plots#
Scatter plots display the relationship between two (or three) metrics at a fixed step, without a traditional x-axis field. This is useful for exploring trade-offs like accuracy vs. compute or loss vs. accuracy.
2D scatter (scatter)#
The mode string has no x-fields — two metrics act as the x and y axes:
malet-plot -exp_folder ./experiments/my_exp \
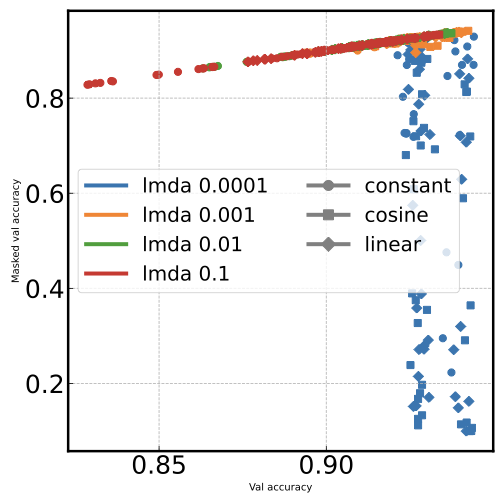
-mode 'scatter--train_loss val_accuracy' \
-filter 'step last'
Each point represents one hyperparameter configuration at the selected step.
3D scatter with color (scatter_heat)#
Add a third metric for color encoding:
malet-plot -exp_folder ./experiments/my_exp \
  -mode 'scatter_heat--train_loss val_accuracy param_count' \
  -filter 'step last' \
  -colors viridis
The first two metrics are the x and y axes; the third metric determines point color. A colorbar is added automatically. Use -zscale log for logarithmic color scaling.
--min.png)
Multi-line support#
scattersupports up to 2 multi-line fields (color + marker)scatter_heatsupports up to 1 multi-line field (marker only, since color is used for the third metric)
malet-plot -exp_folder ./experiments/my_exp \
  -mode 'scatter--train_loss val_accuracy' \
  -filter 'step last' \
  -multi_line_fields 'optimizer'
Python API#
import matplotlib.pyplot as plt
from malet.experiment import ExperimentLog
from malet.plot_utils.plot_drawer import ax_draw_scatter

log = ExperimentLog.from_tsv('log.tsv')
df = log.melt_and_explode_metric(step=-1)

fig, ax = plt.subplots(figsize=(7, 6))
ax_draw_scatter(ax, df, y_fields=['train_loss', 'val_accuracy'],
                color='#d62728', markersize=15)
ax.set_xlabel('Train Loss')
ax.set_ylabel('Val Accuracy')
fig.savefig('scatter.png', dpi=150, bbox_inches='tight')
ax_draw_scatter parameters#
Parameter |
Type |
Default |
Description |
|---|---|---|---|
|
|
— |
Matplotlib axes |
|
|
— |
Melted DataFrame with |
|
|
— |
Exactly 2 metric names for x and y |
|
|
|
Marker face color |
|
|
|
Marker style |
|
|
|
Base marker size (scaled 20x internally) |
ax_draw_scatter_heat parameters#
Same as ax_draw_scatter, but:
Parameter |
Type |
Default |
Description |
|---|---|---|---|
|
|
— |
Exactly 3 metric names (x, y, color) |
|
|
|
Colormap for the third metric |
|
|
|
Color normalization |