
Heatmaps#
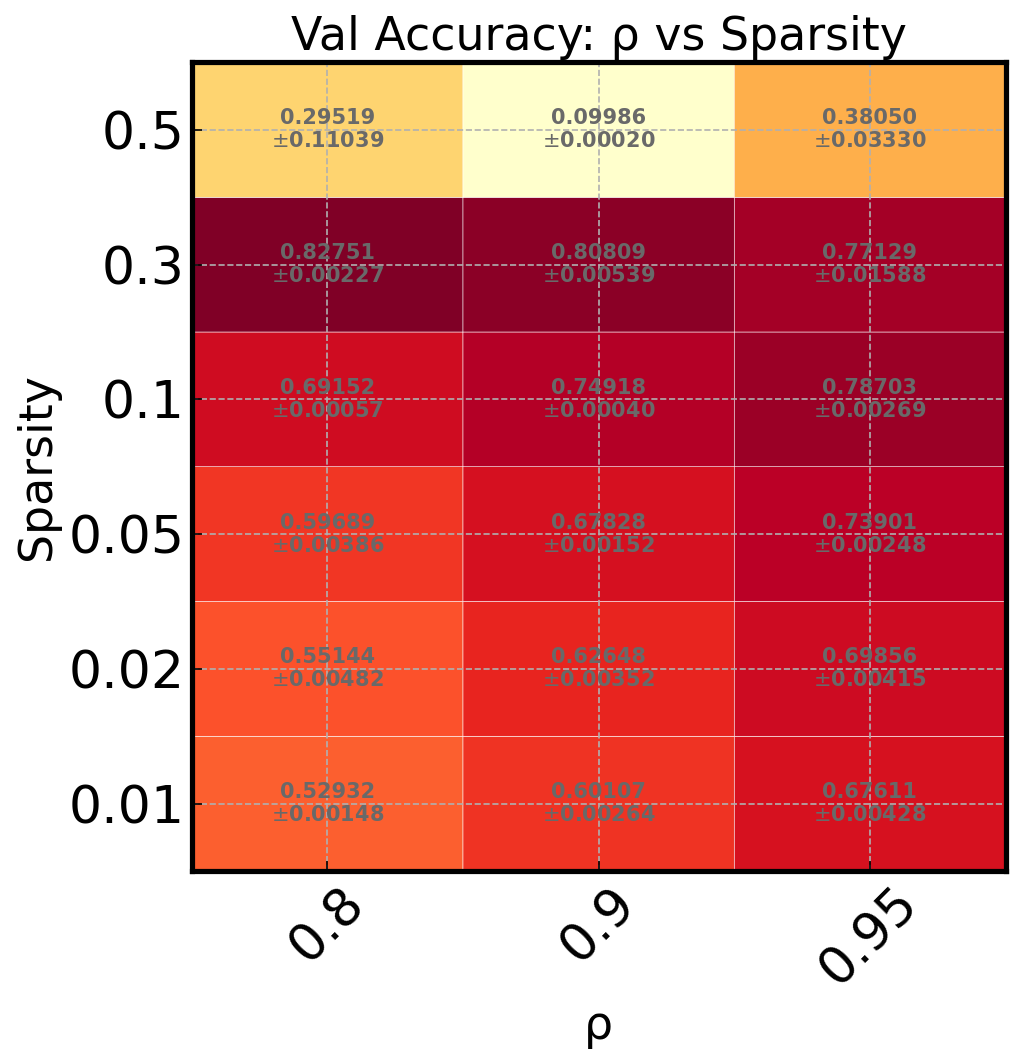
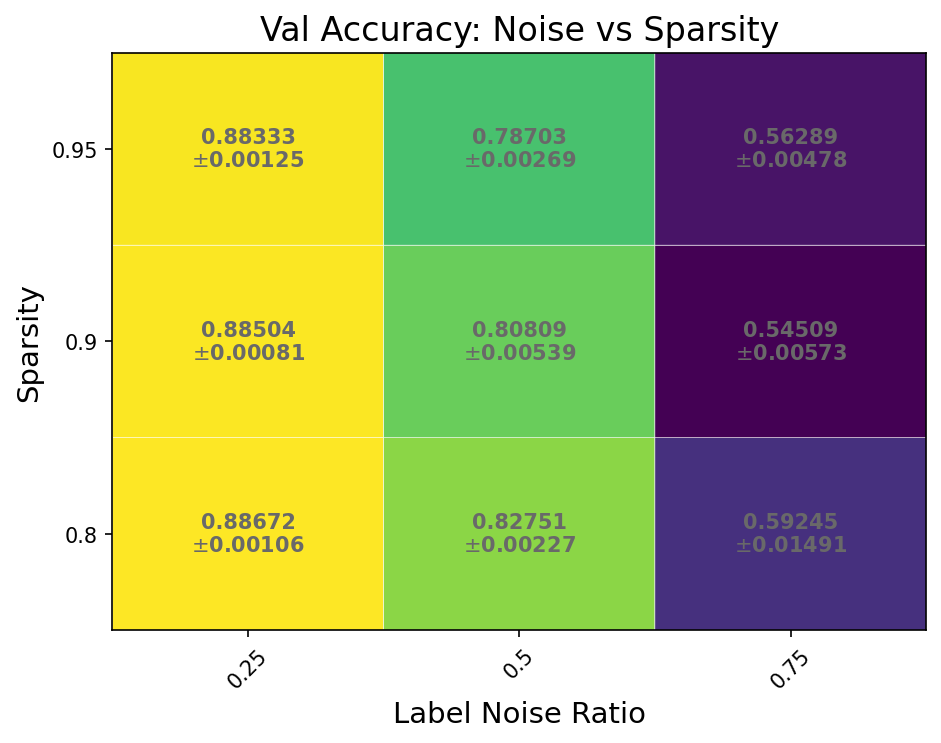
Heatmaps visualize a metric over two hyperparameter dimensions simultaneously, making it easy to identify optimal regions in the hyperparameter space.
Basic usage#
The mode string takes two space-separated x-fields:
malet-plot -exp_folder ./experiments/my_exp \
  -mode 'heatmap-lr weight_decay-val_accuracy' \
  -filter 'step last' \
  -best_at_max
The first x-field maps to columns, the second to rows. The metric value determines the cell color.
Colormap and scale#
Control the colormap with -colors and the scale with -zscale:
malet-plot -exp_folder ./experiments/my_exp \
  -mode 'heatmap-lr weight_decay-val_accuracy' \
  -filter 'step last' \
  -colors viridis \
  -zscale log
The -zscale log option uses logarithmic normalization for the colorbar — useful when metric values span several orders of magnitude.
Annotations#
By default, each cell displays its numeric value. Disable with -noannotate. When averaging over seeds, the standard error is shown below the mean.
Python API#
import matplotlib.pyplot as plt
from malet.experiment import ExperimentLog
from malet.plot_utils.data_processor import avgbest_df, select_df
from malet.plot_utils.plot_drawer import ax_draw_heatmap

log = ExperimentLog.from_tsv('log.tsv')
df = log.melt_and_explode_metric(step=-1)
df = select_df(df, {'metric': 'val_accuracy'})
df = avgbest_df(df, 'metric_value', avg_over={'seed'}, best_at_max=True)

# Keep exactly two index levels
drop = [n for n in df.index.names if n not in ('lr', 'weight_decay')]
df = df.reset_index(drop, drop=True).sort_index()

fig, ax = plt.subplots(figsize=(8, 5))
ax_draw_heatmap(ax, df, cmap='YlOrRd', annotate=True)
ax.set_xlabel('Learning Rate')
ax.set_ylabel('Weight Decay')
ax.set_title('Val Accuracy')
fig.savefig('heatmap.png', dpi=150, bbox_inches='tight')
ax_draw_heatmap parameters#
Parameter |
Type |
Default |
Description |
|---|---|---|---|
|
|
— |
Matplotlib axes to draw on |
|
|
— |
Two-level MultiIndex DataFrame |
|
|
|
Matplotlib colormap name |
|
|
|
Show values inside cells |
|
|
|
Color normalization (e.g., |
Heatmaps do not support multi_line_fields. Use multi_plot_fields to create a grid of heatmaps for different categories.